Export audit logs to EventBridge
Explore organization change events in your existing AWS monitoring suite.
Enterprise customers can now route Buildkite Audit Log events via the AWS Event Bridge event bus.
Himal
API access allowlist
Restrict API access to IP addresses and CIDR block ranges you trust.
You can now easily create and manage a list of IP addresses and CIDR blocks that are authorized to access your organization via the Buildkite API, improving security and reducing the risk of unauthorized access.
Learn more about configuring IP/CIDR allowlist via the UI, API, or Terraform
James
New environment variables for group steps
Jobs that belong to group steps will now have access to information about their group with three new environment variables:
BUILDKITE_GROUP_IDBUILDKITE_GROUP_KEYBUILDKITE_GROUP_LABEL
You could use these variables to upload steps to the same group, or alter the behaviour of jobs based on their group. These environment variables will be absent for jobs that do not belong to group steps.
David
Signal and signal reason in automatic retry rules
Jobs can now be automatically retried based on the signal received by the command process that caused it to exit, in addition to the job's exit code.
This is particularly useful in catching terminated agent hosts, such as you'd see when using EC2 Spot Instances:
1 2 3 4 5 6 7 8 9 10 11- label: "Tests" command: "tests.sh" retry: automatic: # Catch cleanly-terminated instances - limit: 2 signal_reason: "agent_stop" # Catch timed-out agents - limit: 2 exit_status: -1 signal_reason: none
David
Build Matrix support for plugins and agents
Build Matrix has been extended to support matrix variable interpolation inside the plugins and agents attributes of command steps.
1 2 3 4 5 6 7 8 9 10 11 12 13 14 15 16steps: - label: "💥 Matrix Build" command: "echo {{matrix.os}} {{matrix.arch}}" agents: queue: "builder-{{matrix.arch}}" matrix: setup: arch: - "amd64" - "arm64" os: - "windows" - "linux" plugins: - artifacts#v1.9.0: upload: "out/{{matrix.arch}}.gz"
David
Build waterfall view
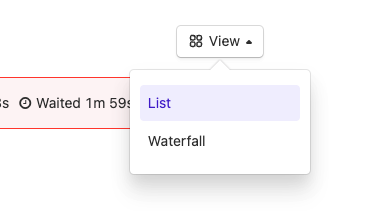
The waterfall view visualizes the timeline of each step in a build. You can see this summary in your Builds page a toggle–enabling to switch between list and waterfall views.
Oz
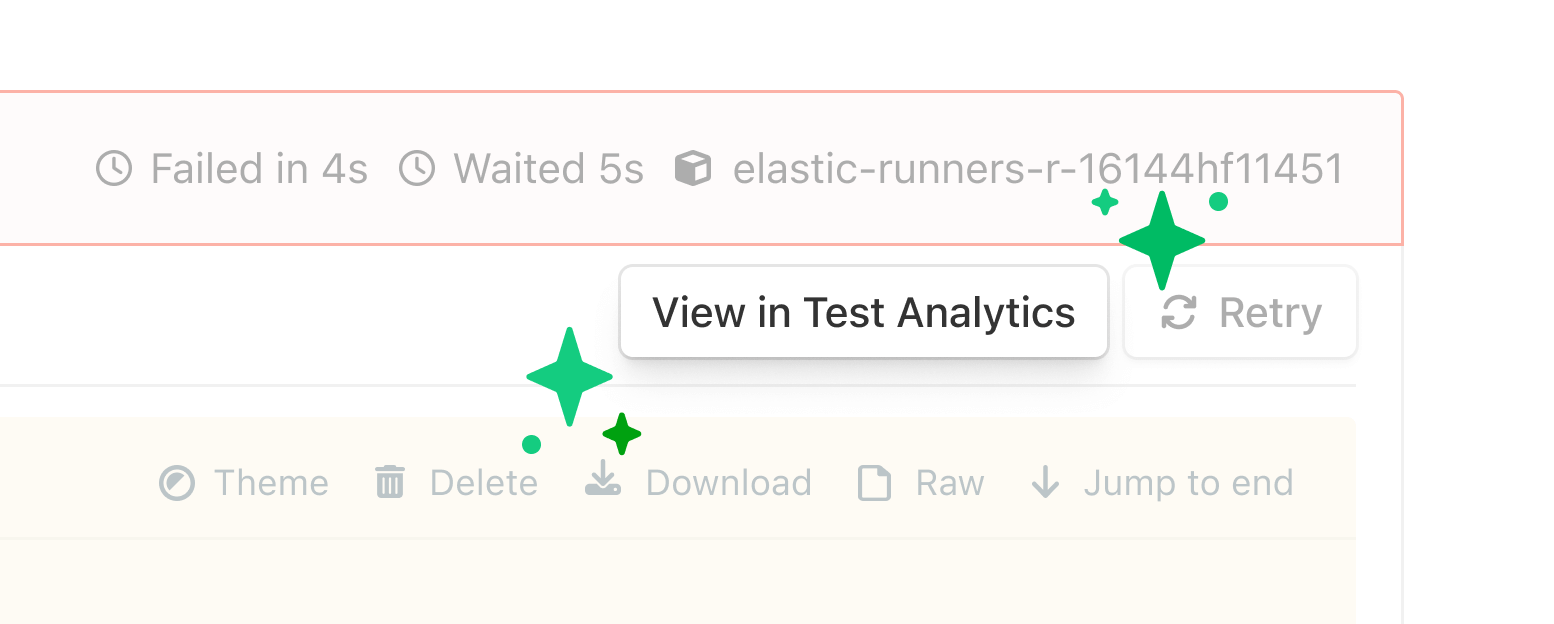
Go straight from failed jobs to Test Analytics
Quickly view insights about failed tests by going directly from a job to its related information in Test Analytics – providing a faster path from fail to fix.
Michelle
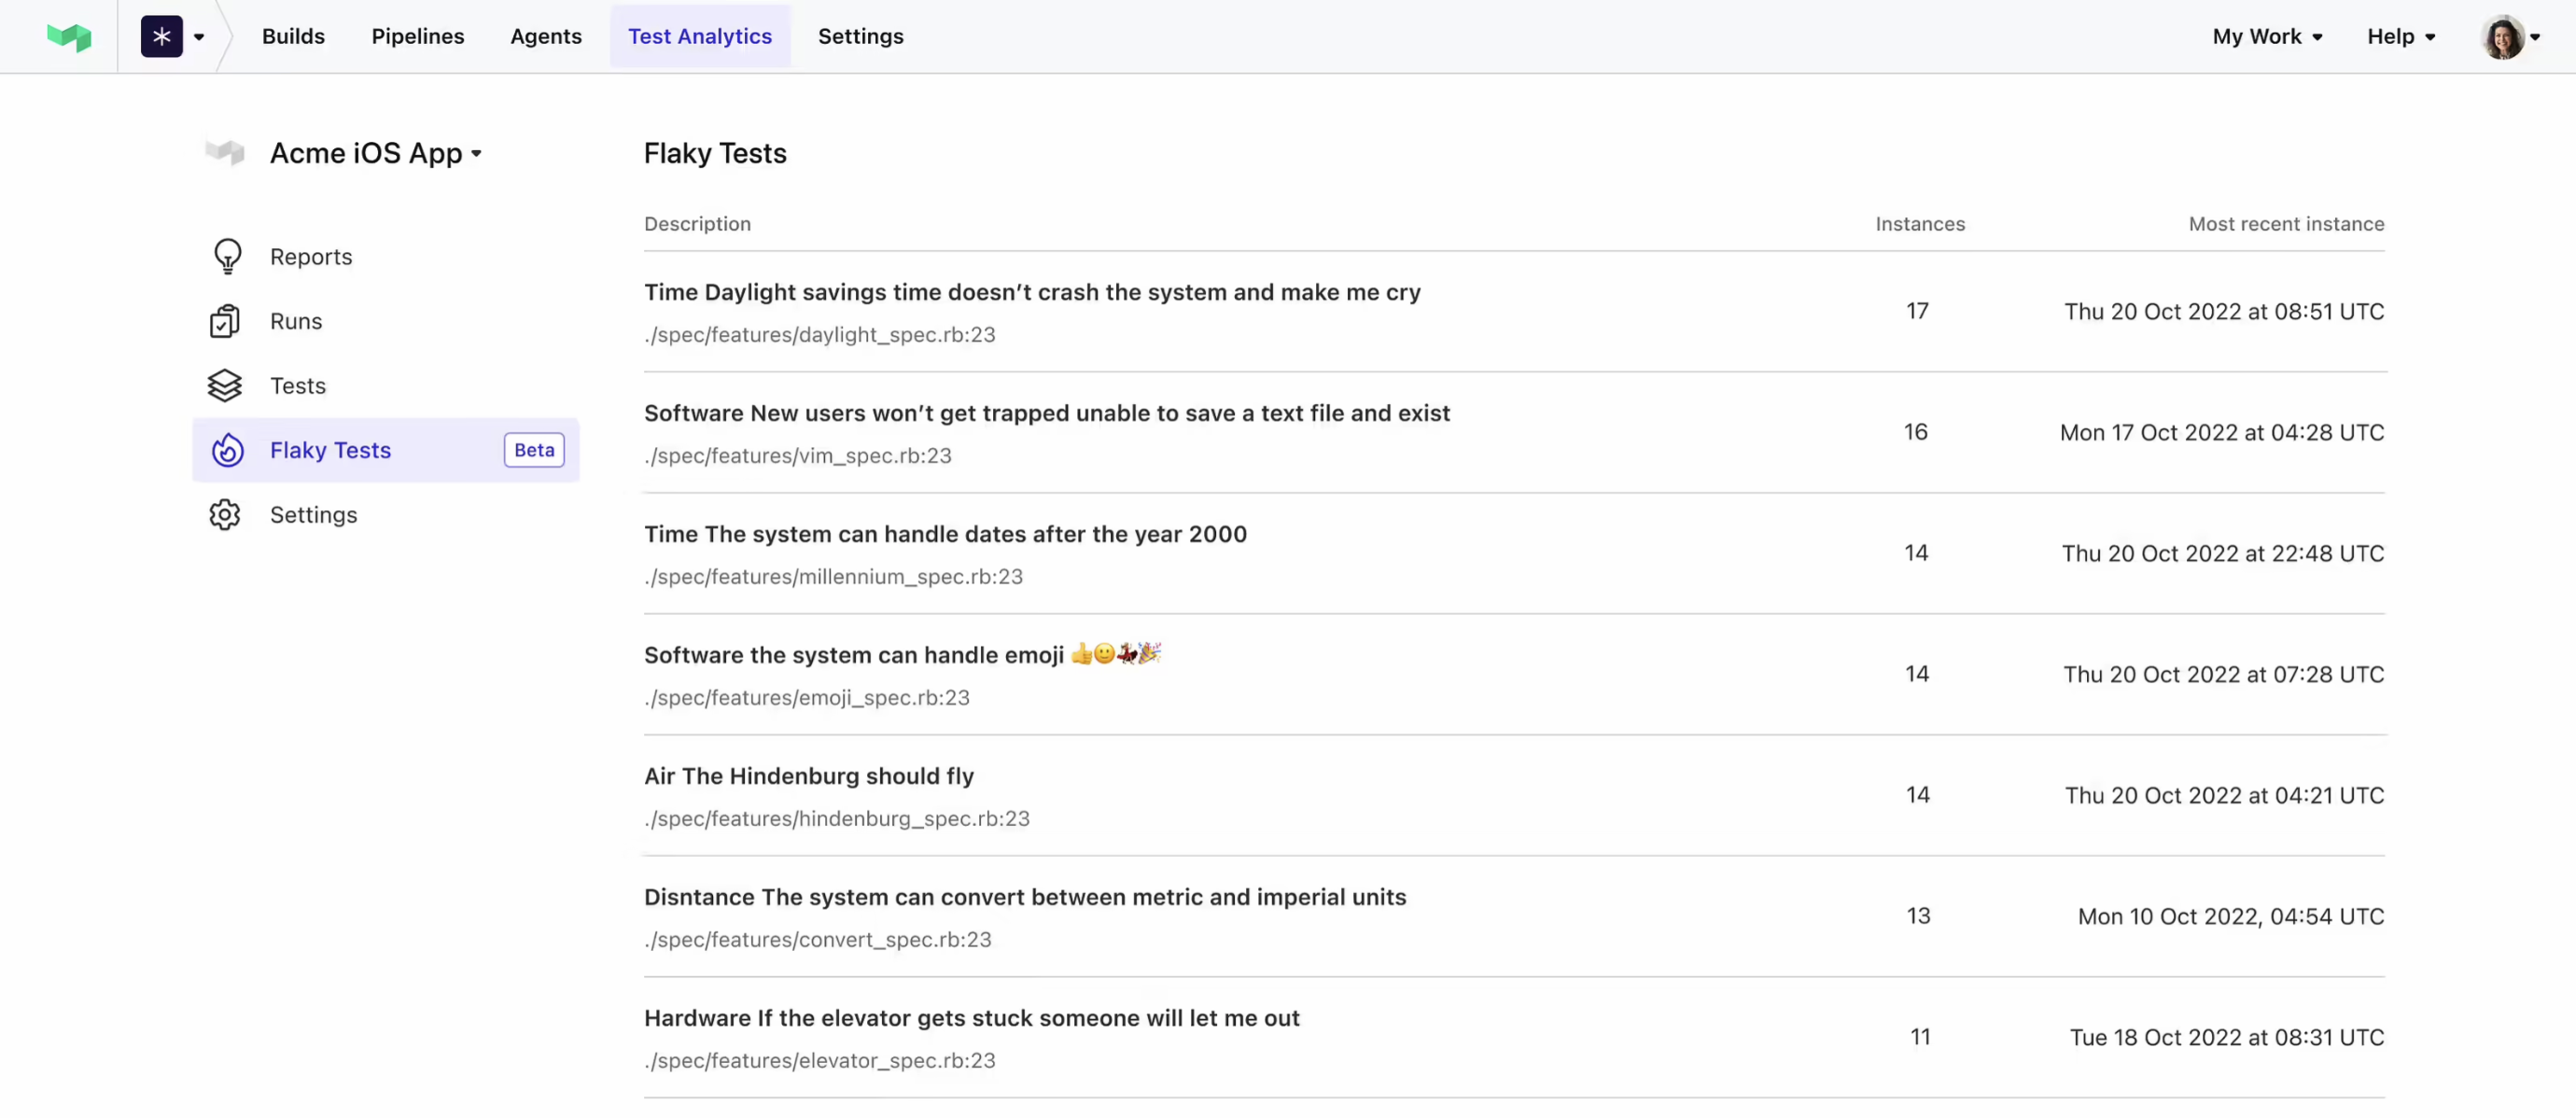
Test Analytics now automatically detects flaky tests
Flaky tests are automated tests that produce inconsistent or unreliable results, despite being run on the same code and environment. They cause frustration, decrease confidence in testing, and waste time while you investigate whether the failure is due to a genuine bug.
Test Analytics finds your flakes by surfacing when the same test is run multiple times on the same commit SHA with different results. The tests might run multiple times within a single build or across different builds. Either way, they are detected as flaky if they report both passed and failed results.
Results are available in the Test Analytics UI and via a new REST API endpoint.
Learn more about flaky test tracker and its API
Michelle
Pipeline tags
Pipeline tags make it easier to sort through and filter multiple pipelines. Tag names support both text and emojis. You can now tag your pipelines and use the search bar to find tags.

Tags are unique per pipeline, don't contain line breaks and are capped at 64 characters. You can have 5 tags per pipeline.
Tags can also be set through REST and GraphQL APIs.
To set the tags, go to Pipeline Settings > General > Tags
Oz
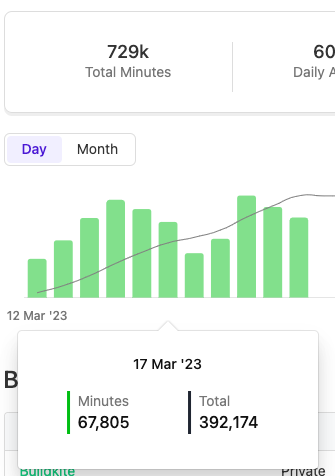
Usage breakdown: understand your usage by pipeline and test suite
Analyze your usage by pipeline or test suite, with the option to view monthly or daily breakdowns. Delve into previous billing periods, and conveniently export your data for offline analysis.
Learn more about usage breakdown
James
Pipelines glossary added to the docs
We've added a glossary to highlight and explain the core concepts of pipelines.
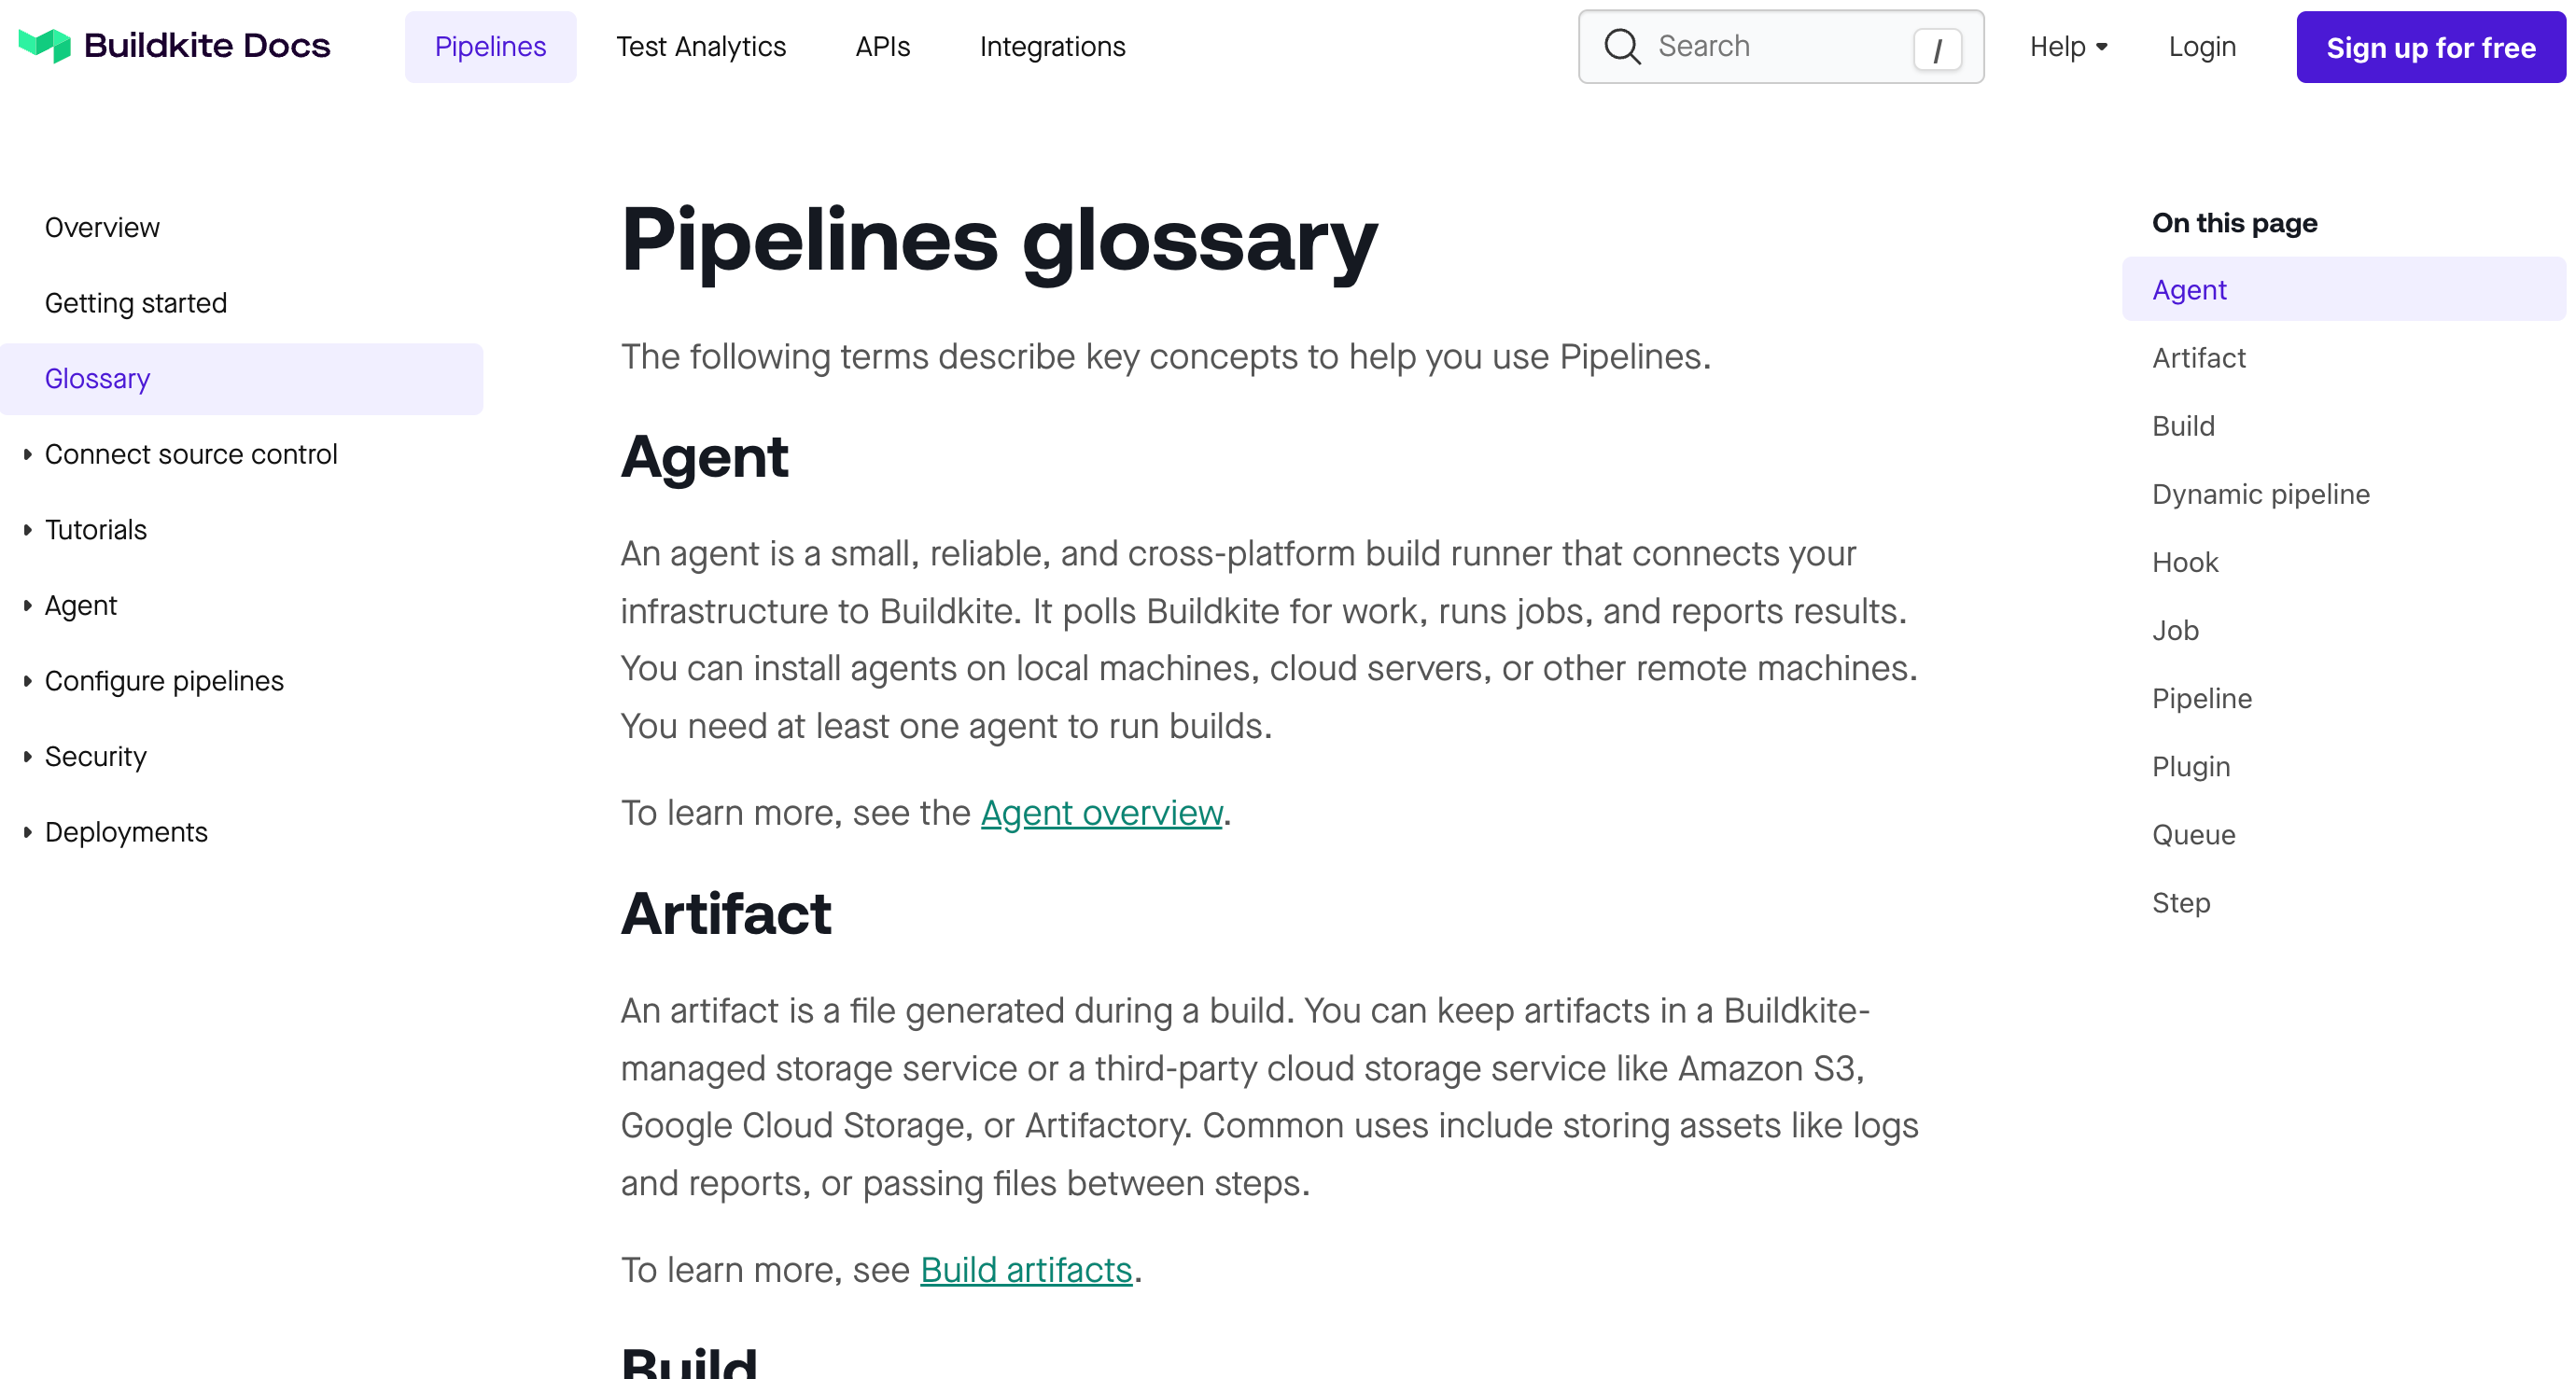
See Pipelines glossary to check it out. ✨
Michael
New docs for using GitHub merge queues
We’ve added a guide to help you set up merge queues in your pipelines. Merge queues are a feature of GitHub to improve development velocity on busy branches. ✨
See Using GitHub merge queues to learn more. 📚
Michael
Introducing: Themed Job Logs
Job logs now have the addition of light theme on build summaries – ensuring those that find lower contrast easy-to-read have an alternative option.
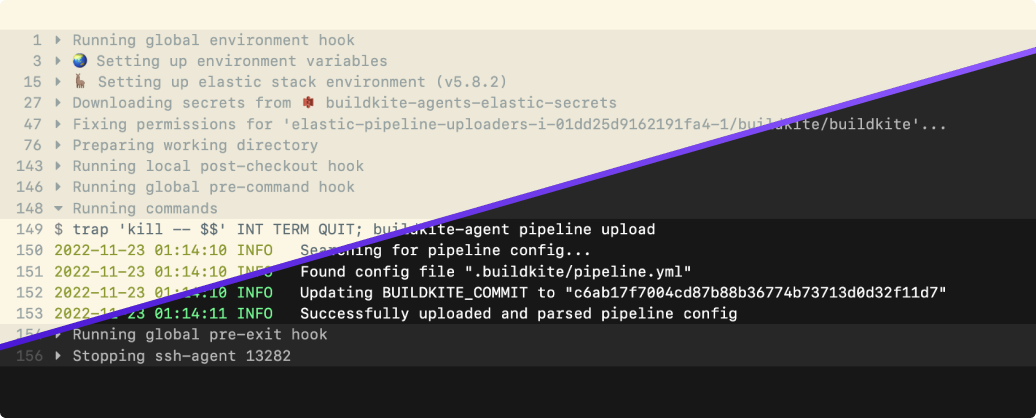
Unblocking engineers - and your work – is the core theme of how we think of everything here at Buildkite, including usability. The new light theme was inspired by Ethan Schoonover's Solarized theme. Now, when you open a job log, you’ll see a new “Theme” control – enabling you to switch between our current dark mode theme and the new light theme. Your preference will be saved for future views, with the option for you to switch views.
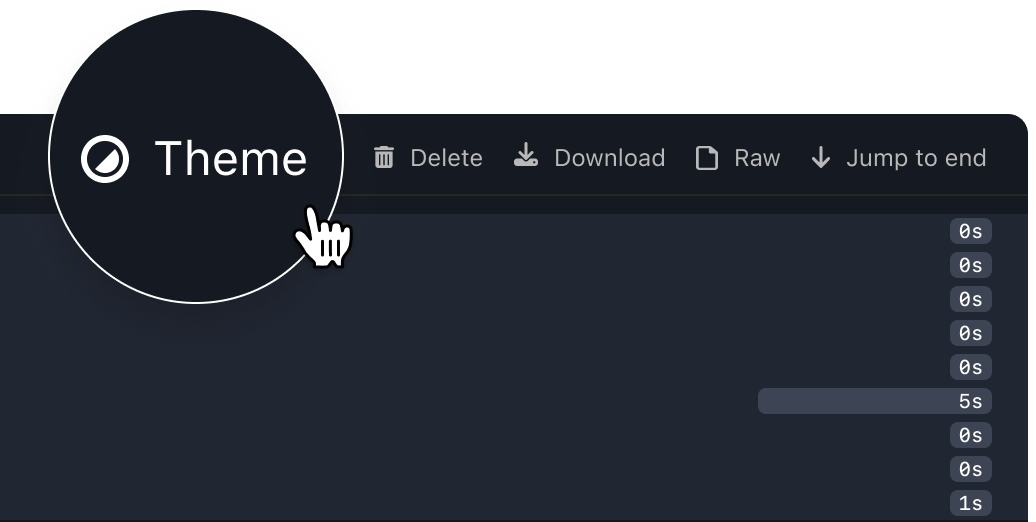
As always, we'd love your feedback. Drop into our Slack community, or send us an email: hello@buildkite.com �👋
Kalo
Multiple GitHub Enterprise Servers support
Today we’re introducing the ability to configure multiple GitHub Enterprise Servers.
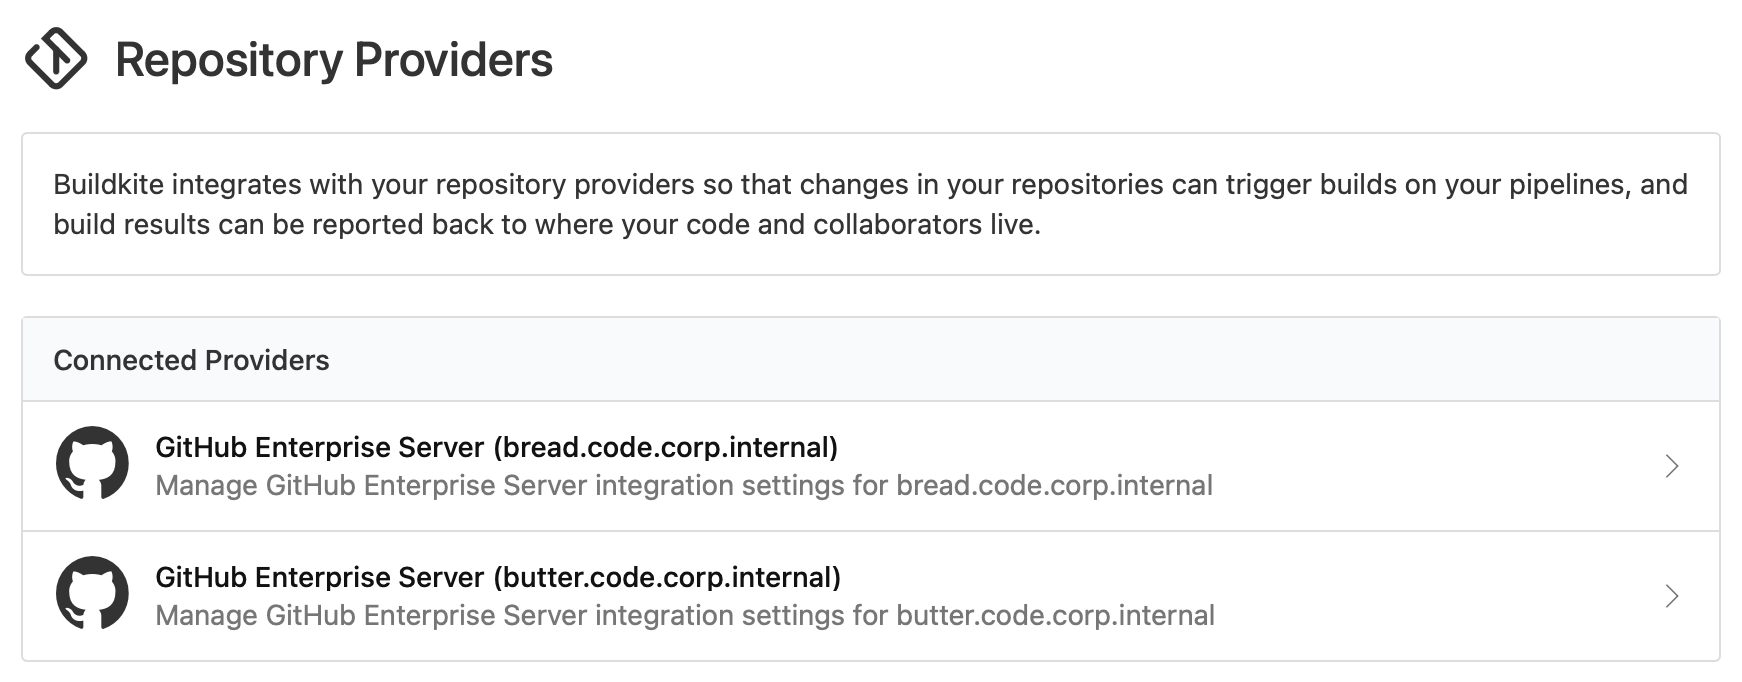
Some of our bigger teams with different requirements for source control have multiple GitHub Enterprise Server installations. We’ve only supported one per Buildkite organization — until now. If you’re on a compatible plan, you can now add as many different servers as you like from the repository providers page in your organization settings.
We love feedback! If you use this feature and love it, or it doesn’t quite do what you need, drop into our Slack community, or send us an email: hello@buildkite.com 👋
Samuel
Introducing: The Build Issues Tab
Failed builds now jump straight to a new Issues tab on the build page 🗂
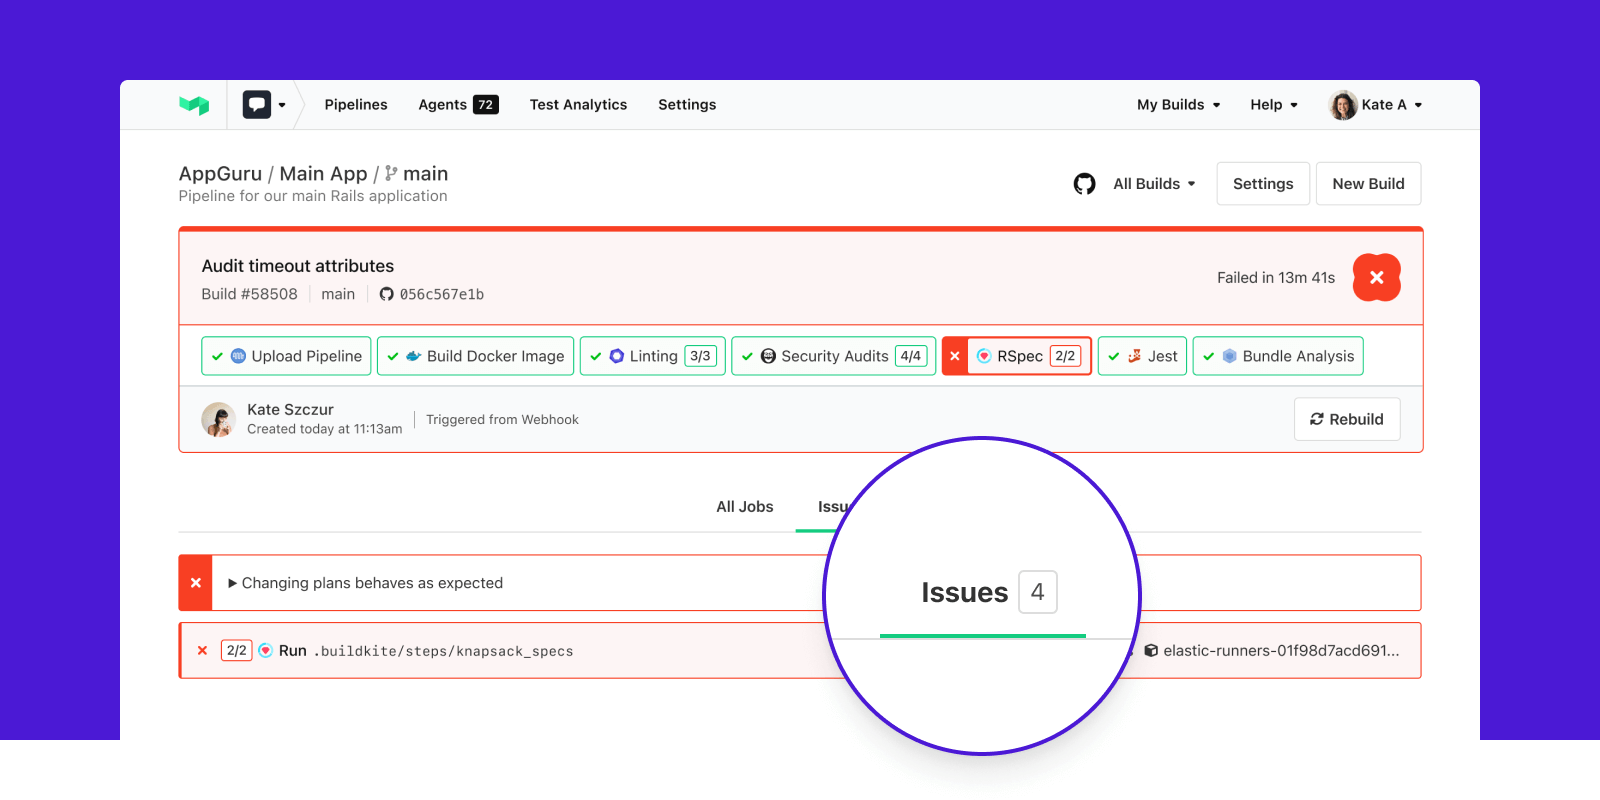
Builds with hundreds of jobs can hide what really matters. Instead of scrolling through the noise, Issues shows you only the failed annotations and jobs in a build. This helps you get your code shipping faster. And the rest of your jobs are only a tab click away.
Check out the blog post to learn more about this change.
As always, we'd love your feedback. Drop into our Slack community, or say hi: hello@buildkite.com 👋
Samuel
Build Retention
Update, Sep 2023: We are no longer offering per pipeline build retention. For more information on retention per plan, see check out the docs.
Today, we're introducing build retention controls for pipelines so you can automatically remove old builds ⏰🧨
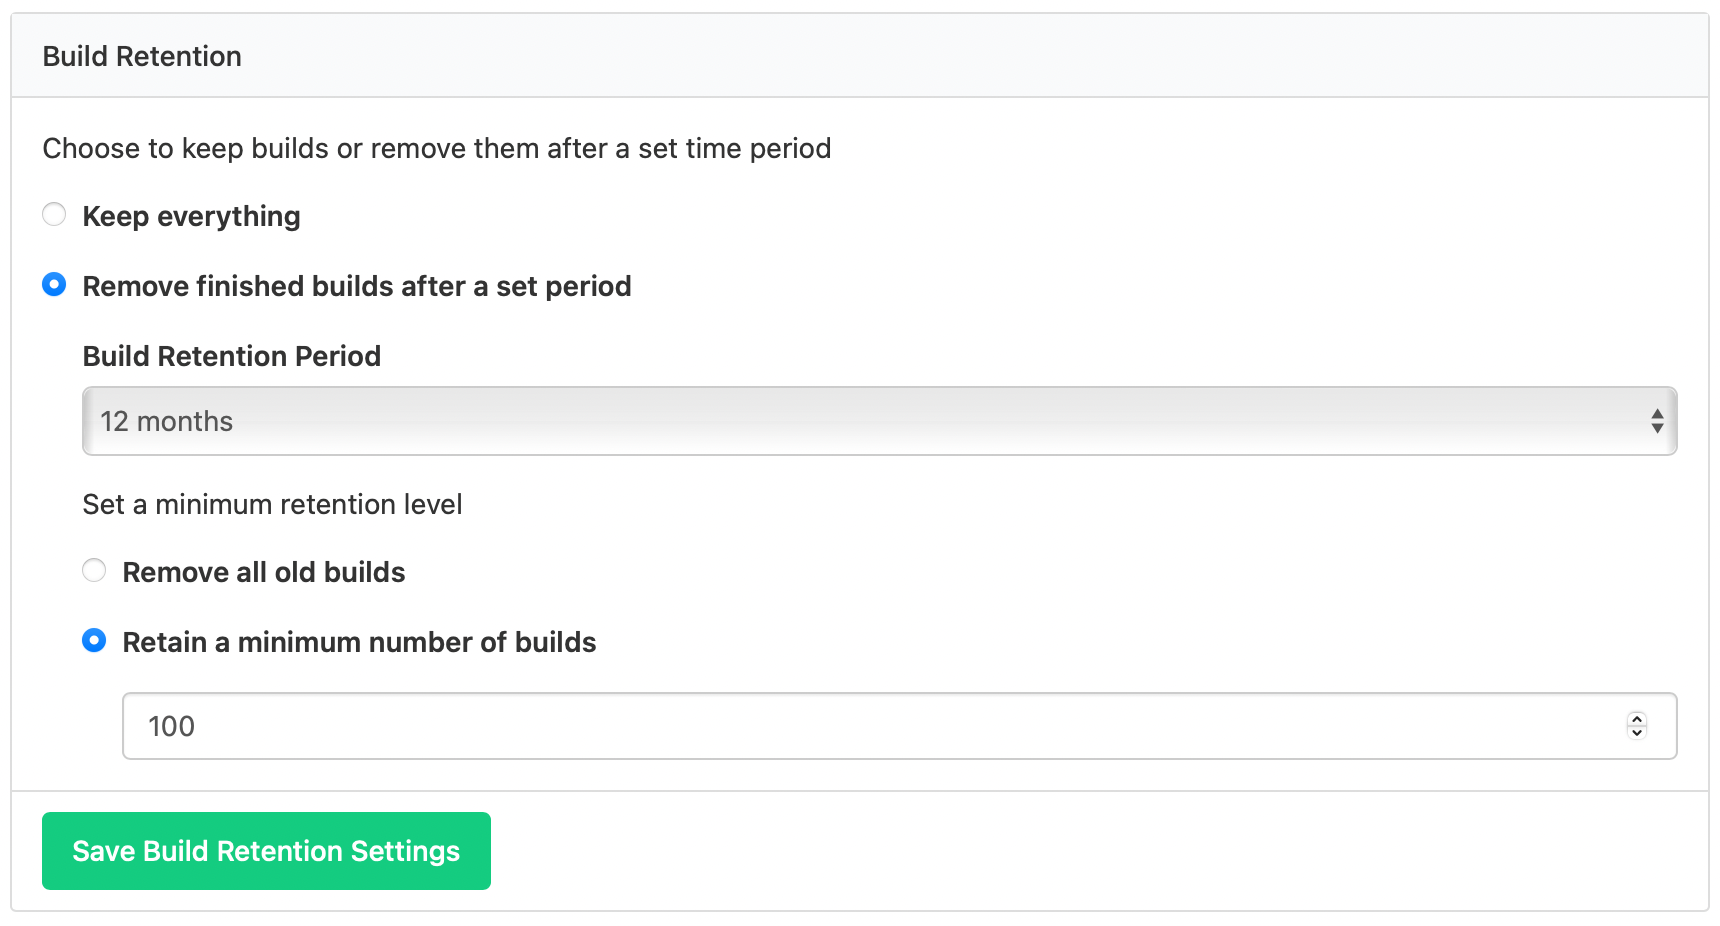
You can now configure pipelines to keep builds for a certain period of time. There's also an option to always keep a minimum number of the latest builds, so you don't lose context on pipelines that don't move quite so fast. These are available today — find any pipeline, then go to Settings, Builds, and look for the Build Retention section.
This change is currently optional, but we'll be announcing a broader rollout for build retention soon.
We'd love to hear from you if you find these controls useful, or if they don't quite fit your needs first. Drop into our Slack community, or send us an email: hello@buildkite.com 👋
Samuel
New GraphQL API schema browser
We've released a new schema browser for our GraphQL API 🎉
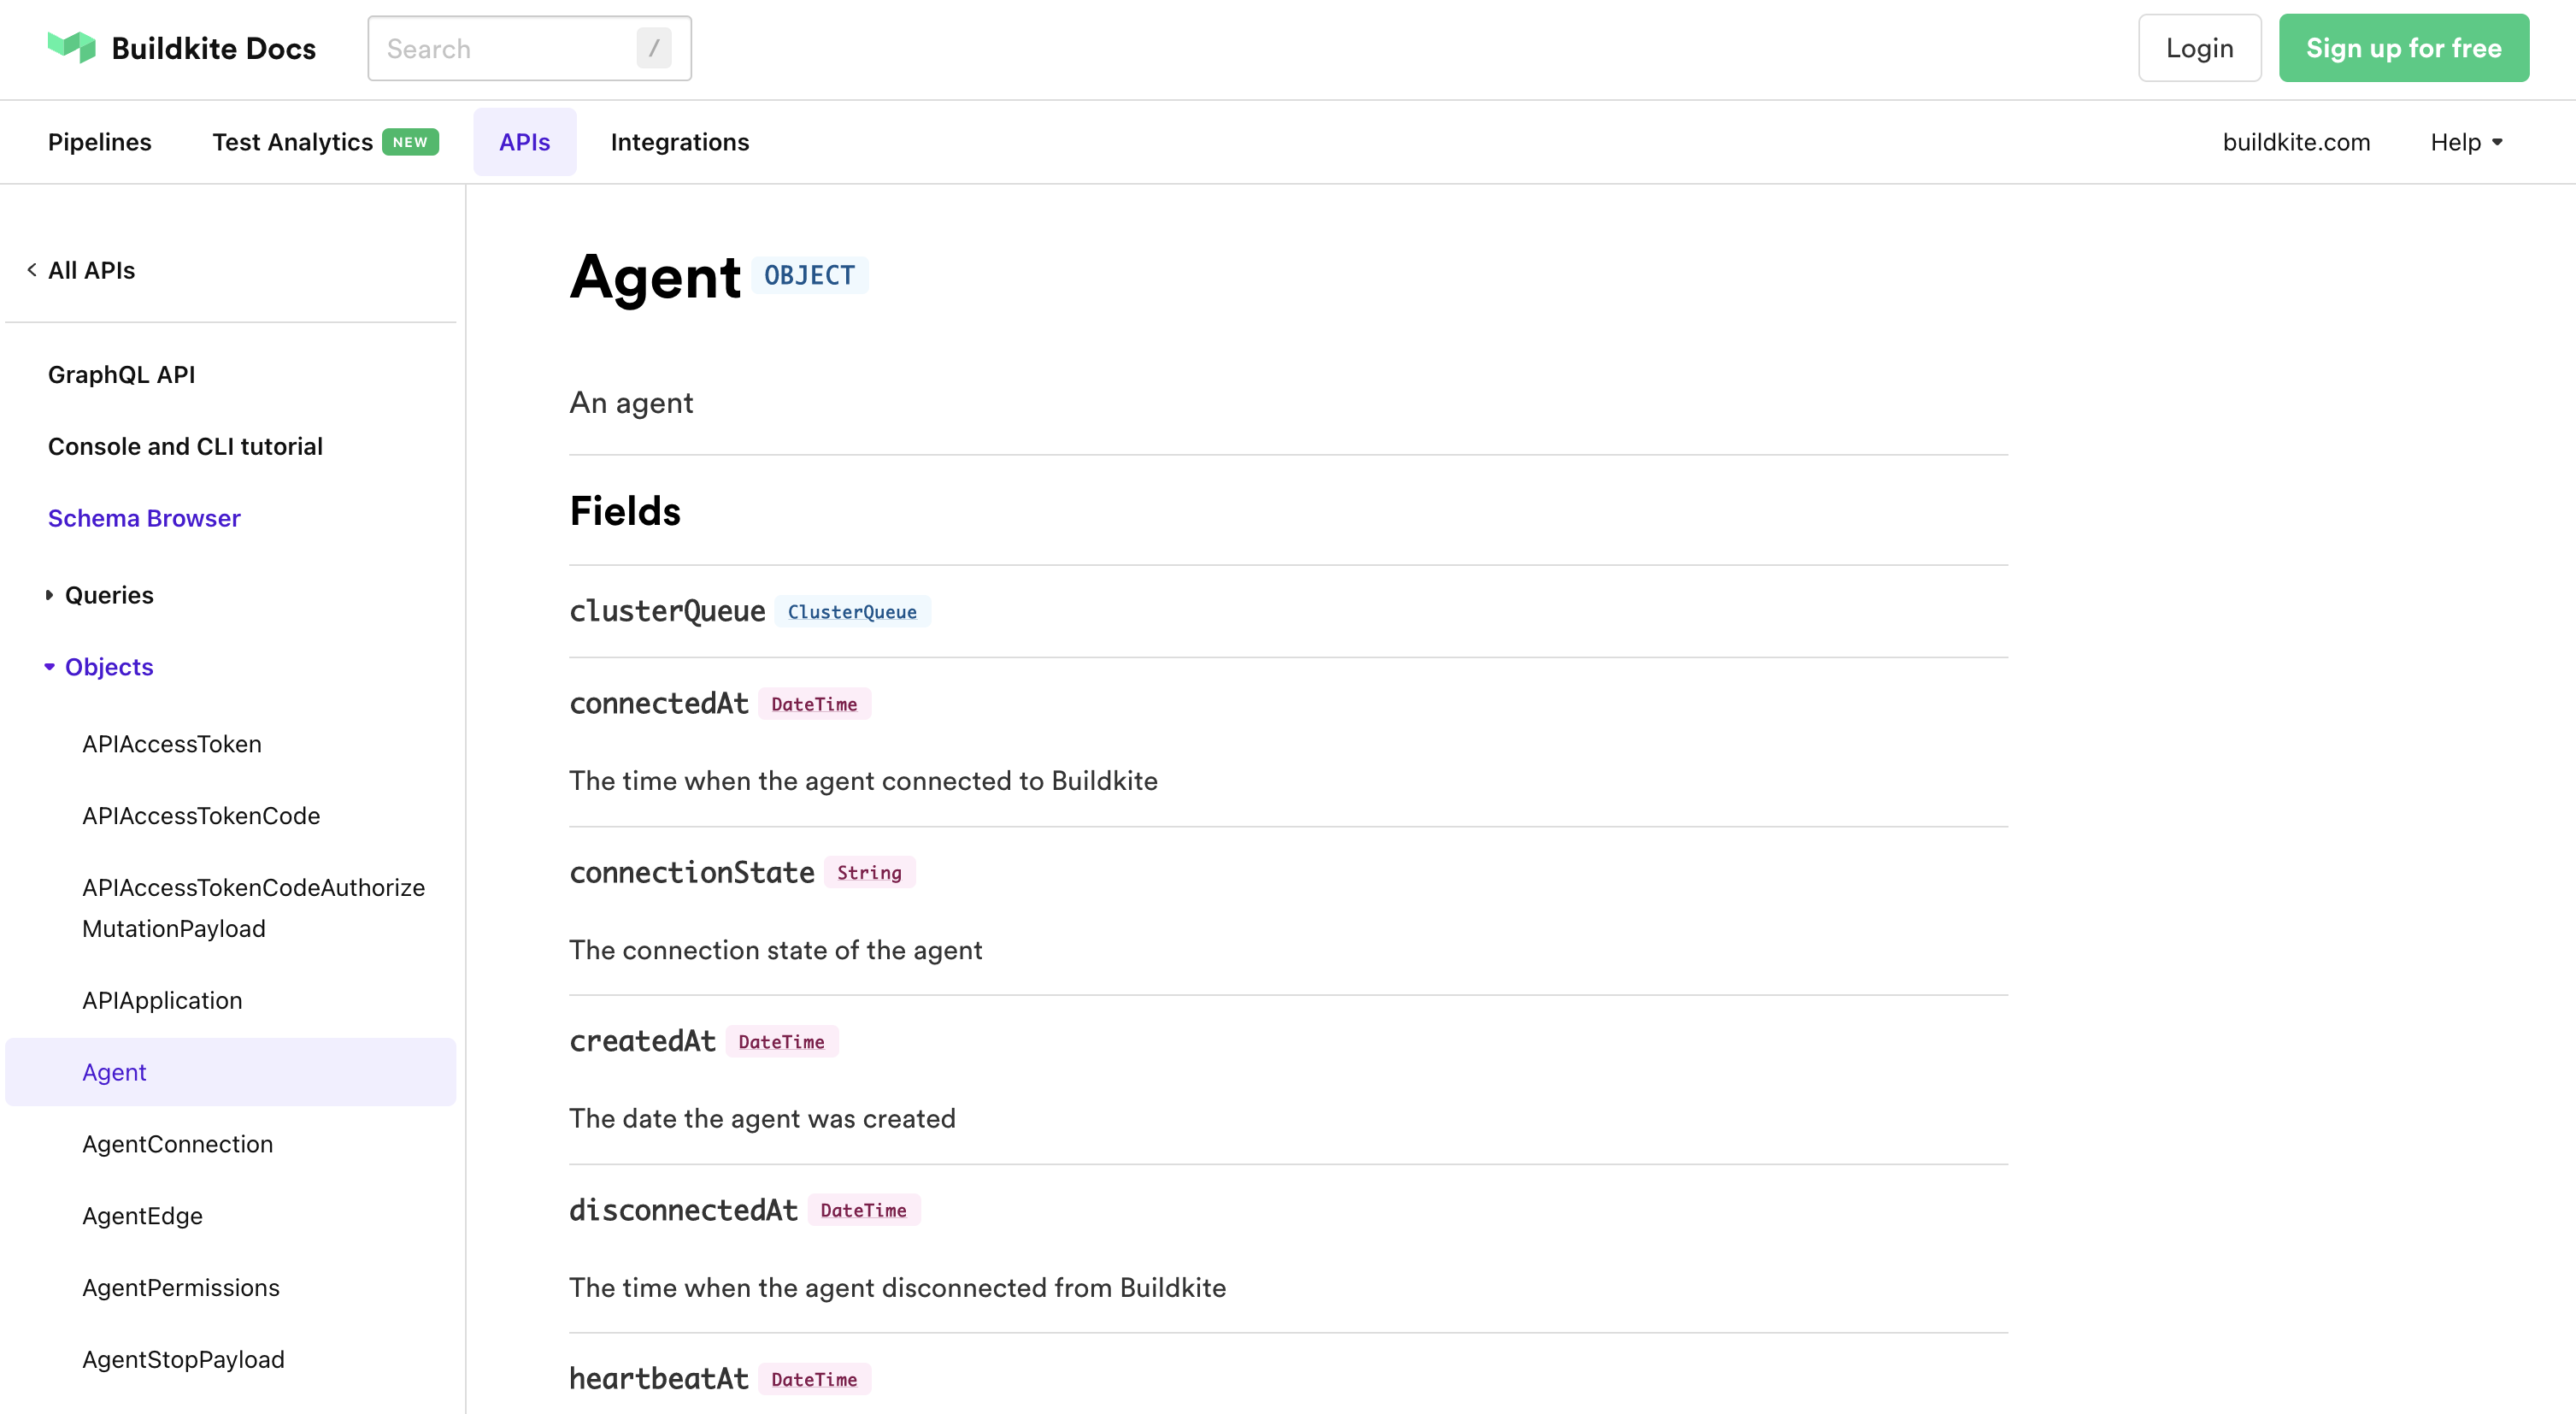
You can now easily browse the entire structure of the API right there in the docs, without needing to log in first
Sam
Default timeouts for command steps
You can now specify default timeouts for command steps ⏰💥
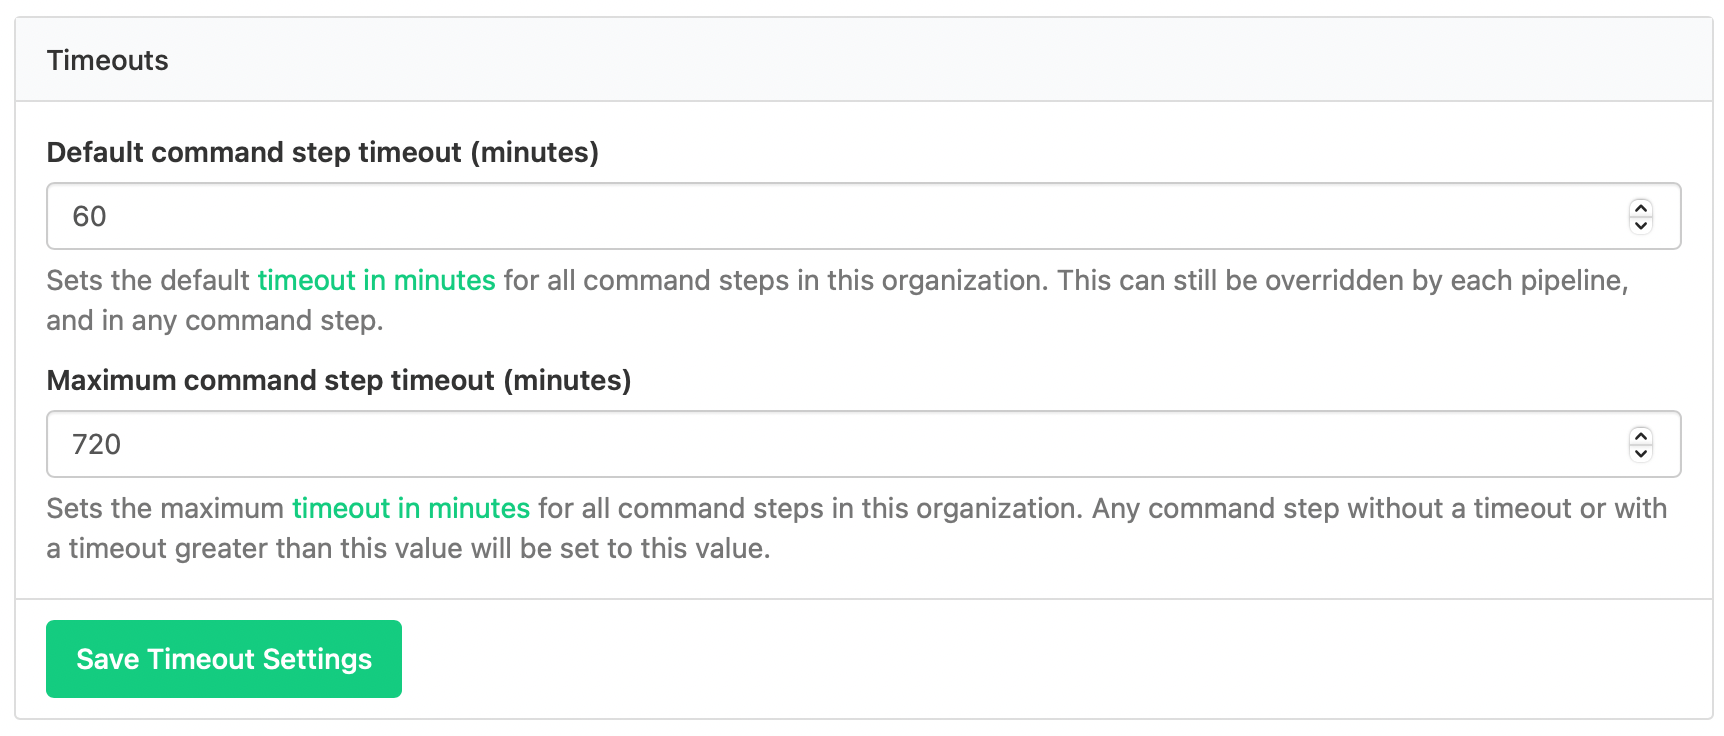
Timeouts can be specified on command steps already, but it's a pain to have to do it every time, and easy to forget. Setting default timeouts means you won't have command steps slip through the cracks and accidentally run forever, or consume too many job minutes.
Default and maximum timeouts can be specified at an organization and pipeline level. Defaults apply in order of specificity — the step's timeout will be used if supplied, otherwise it defaults to the pipeline's default if supplied, or finally to the organization. Maximums are always enforced, when supplied — the smallest value will be used.
These timeouts can be configured from your organization's Pipeline Settings page, or on a pipeline's Builds settings page.
We'd love to hear from you if you find these timeouts useful, or if they don't quite fit your needs first. Drop into our Slack community, or send us an email: hello@buildkite.com 👋
Samuel
Beta: Failing builds fast
Today we're introducing a new "failing" build state for faster feedback 🏃♂️💨
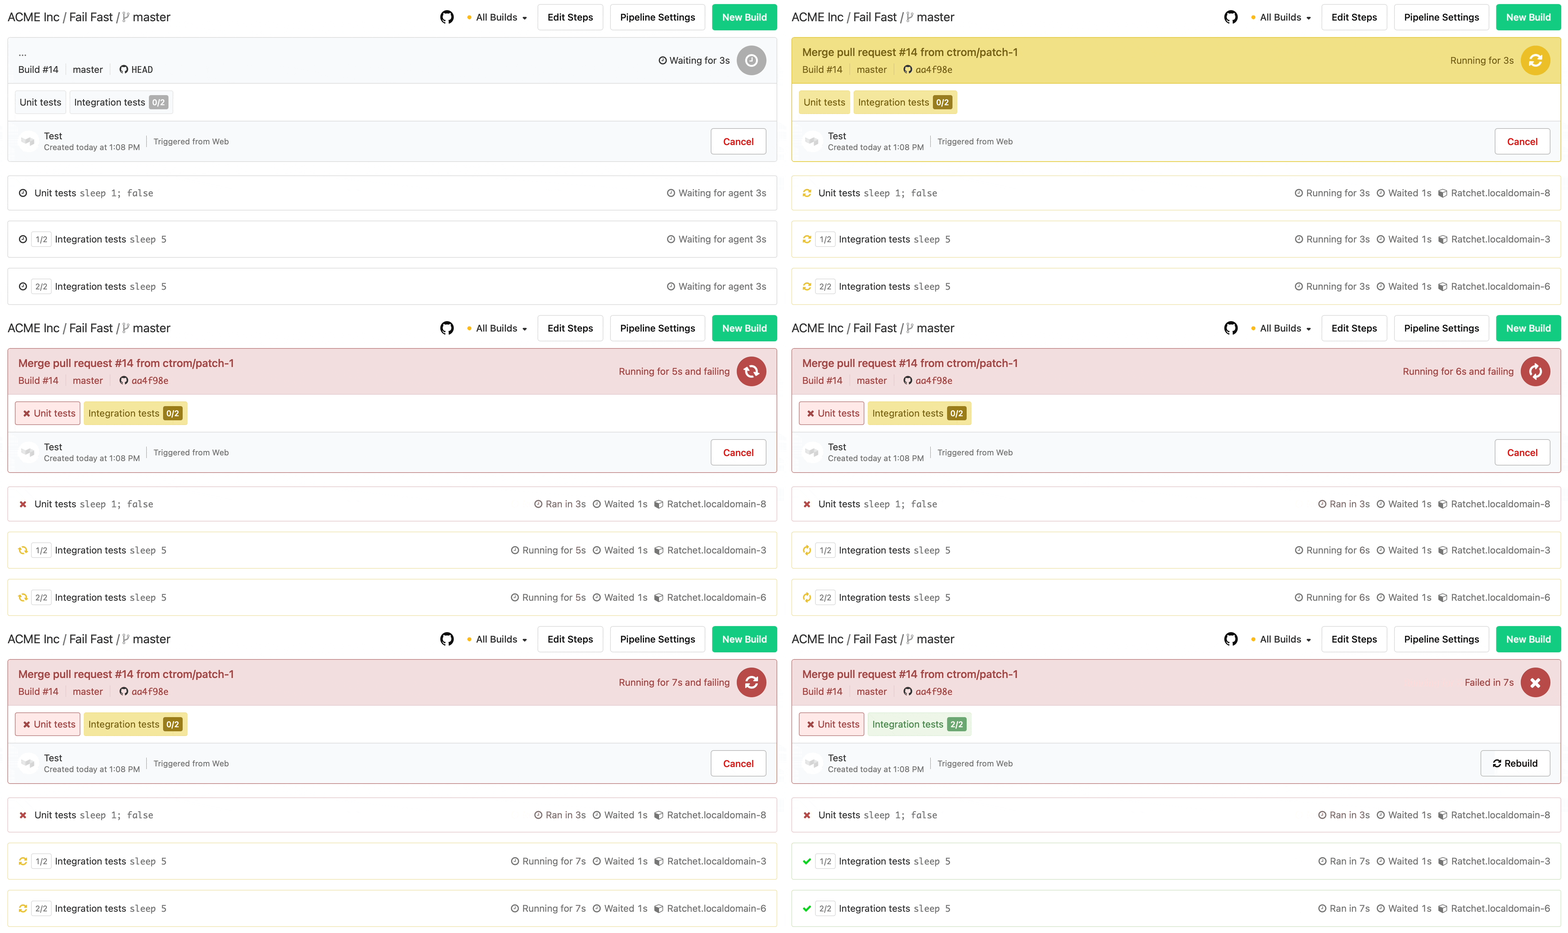
We know it's frustrating when your build fails. But when it does, you want that information as soon as possible so you can get it green.
Now, as soon as a single job fails, the build can be marked as "failing". You'll see a GitHub Commit Status, or a Slack notification — whatever your team uses — as soon as we know your build is going to fail. And on the dashboard your build will show as failing. If you're using annotations or Test Analytics then your build can also tell you what to do to fix the problem while it's still finishing.
But fast feedback is only half of the equation. There's nothing worse than a build which takes forever just to tell you it's broken. If you're in a big team running lots of builds, running the rest of a failing build might be a waste of time. So we're also introducing "cancel on build failing."
1 2 3 4steps: - command: bundle && bin/rails spec parallelism: 100 cancel_on_build_failing: true
Adding the cancel_on_build_failing: true attribute to your command steps will cause those jobs to be canceled as soon as a build becomes failing. That way your agents can move on to the next piece of work. But we'll still send failing notifications before cancelation is complete.
We realise that some folks might need to update API clients or adjust pipeline and workflows, so this new feature is being introduced as opt-in for a smooth migration path. But you can turn on failing builds right now by going to your pipeline on the Buildkite dashboard, then going to the Settings page, Builds, and enabling Fail Fast:
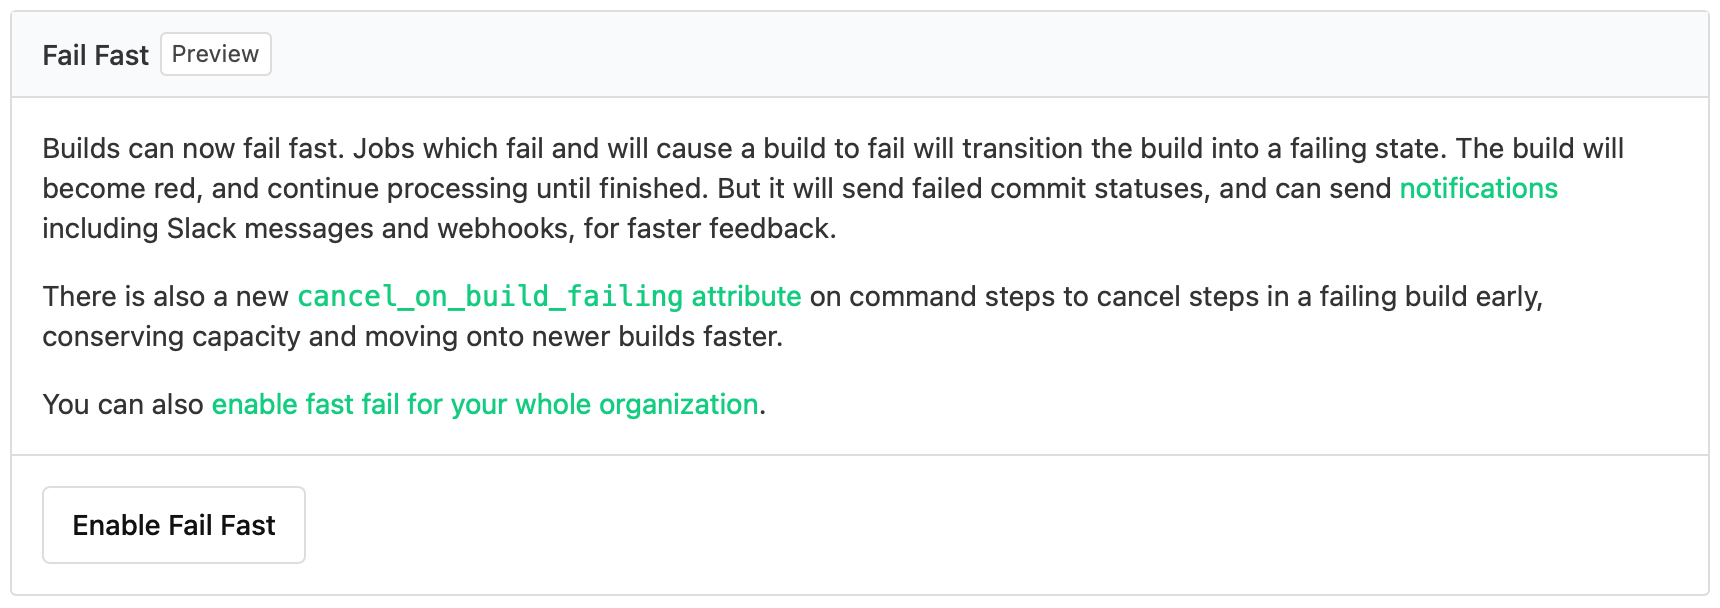
You can also turn this on for your whole organization on your org's Pipeline Settings page.
The buttons will go away and the feature will be enabled for everybody on Monday, 5th September, 2022.
If this does exactly what you need, or you have a suggestion, we'd love to hear from you in our community Slack channel, or drop us an email to support@buildkite.com.
Samuel
New environment variable: Pull request draft
For customers triggering builds via GitHub, we've added a new environment variable to track the draft status of a pull request:
1BUILDKITE_PULL_REQUEST_DRAFT="true"
If a pull request triggers a build while in a draft state, this variable will be present in all the build's command jobs. The variable will be absent otherwise.
This variable allows customizing your uploaded pipelines or running jobs at the agent level based on a pull request's draft status. For example, you might run a faster subset of your tests while a pull request is still in a draft state.
Check out our docs on environment variables for more information.
If you have any feedback, we'd love to hear from you in our community Slack channel, or drop us an email to support@buildkite.com.
Samuel
Start turning complexity into an advantage
Create an account to get started with a 30-day free trial. No credit card required.
